
Visual Studio Debugging Tip: Drag Execution Pointer to Replay Code Execution
I was inspired to share this quick tip after an experience I had recently. I was working with another developer, sharing my screen while we were debugging an issue with some .NET code in Visual Studio. At one point, I used the feature of Visual Studio that allows lines of code to be executed a second time in the same debugging session, without having to do things like restart debugging, re-run loop iterations. I often make the mistake of thinking my colleagues and others already know about all the things Visual Studio can do. In this case though, the developer’s response after seeing me use the feature was to tell me they had no idea it was even possible. This blog post is for anyone who isn’t aware that you can replay lines of code by dragging the execution pointer. There are limitations to when this is allowed, which I will explain as well. Even with the limitations, it can still have several minutes of debugging time when used correctly.
For this example, I’m going to go back to the code that was used as the improved example in Improve C# App Performance by Eliminating Nested Loop Lookups . You can read that post for more information on the code being used for the example. In this case, it doesn’t really matter and I’m just going to show some examples of the debugging technique.
I’ve set a breakpoint and will let the code run to that breakpoint. The execution pointer is stopped at the breakpoint on line 34:
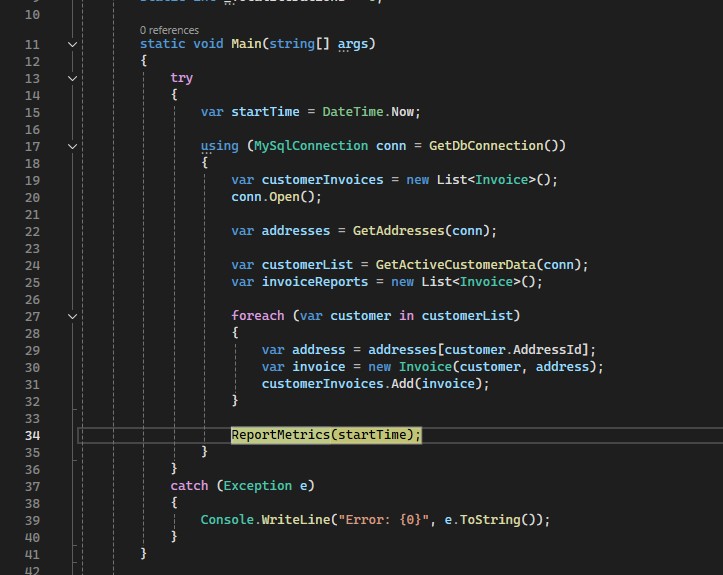
Execution Pointer Stopped at Breakpoint
Here’s the interesting part. From here, I can click on the execution pointer and drag it back to a different part of the code. Here is a gif showing an example:
Dragging Execution Pointer
The pointer can be dragged both backwards and forwards. As you can see, this can help cut down on debugging time significantly.
There are times when this doesn’t work. For example, for operations that can only be executed once, like opening database connections, will throw an error if you try to execute them again.
Connection Already Open
The debugger can sometimes recognize when code can’t be run a second time, and won’t even allow dragging the pointer in these cases. Other times, as in the “connection already open” example, you will get an error.
When using this technique, make sure you know what the possible consequences of re-running code will be. This is particularly important if you need to run the debugger while connected to a production environment for example. A practice that should only be done as a last resort, but we all know that it has to be done sometimes when dealing with complicated troubleshooting scenarios. If you’ve never used this feature of Visual Studio before, I would recommend getting used to it first before trying it in risky scenarios, regardless of the environment.
I just wanted to share this quick tip to help anyone who may not know that this can be done. I hope it saves you some time for future debugging.